Search for maize water requirement Kenya and you will find tables: emergence needs so many millimetres, tasseling needs more, grain fill needs less. They look authoritative because they are precise. They are also, mostly, wrong for your field, because maize water requirement is not a fixed number. It is a calculation done fresh every day, and the inputs to that calculation change with weather, location and planting date in ways a printed table cannot capture.
The advice everyone repeats, and where it comes from
The standard method, set by FAO, is simple in shape: crop water use equals a crop coefficient (Kc) multiplied by reference evapotranspiration (ET0), in millimetres per day. Rain need by maize in Kenya lays this out plainly. Kc changes across four growth stages and by variety, and it peaks in the third stage, roughly the tasseling and silking window when the crop canopy is largest and demand is highest. ET0 itself is not a maize number at all. It is the evaporative demand of the atmosphere, driven by temperature, humidity, wind and solar radiation, independent of what is planted.
This is where the millimetre tables come from. Someone ran Kc times a representative ET0 for a representative location and published the result as if it were a constant. It is not. ET0 varies by day and by place, so the same Kc value produces a different water requirement in a hot, dry week than in a cool, humid one. The FAO method is a procedure, not a lookup table, and treating it as the latter is the first mistake almost every printed guide makes.
The second mistake is subtler. Kc curves are built from trial data on specific varieties grown under specific management. Kenyan growers plant a mix of hybrids and open-pollinated varieties across altitude bands from the highlands to the coast, covered in more detail in Growing Maize in Kenya. A Kc curve fitted to a temperate hybrid trial does not transfer cleanly to a short-season variety grown at altitude in Uasin Gishu.
Why ET0 refuses to sit still
ET0 is the part of the equation growers tend to ignore because it feels like background weather rather than a crop number. That is a mistake, because it is doing most of the work in the multiplication. A day of high solar radiation, low humidity and wind will push ET0 up regardless of what stage the maize is in, and the crop's actual daily water use rises with it even though the Kc value has not changed at all.
This means two fields at the same growth stage, one in a hot, dry lowland and one in a cooler mid-altitude zone, can have meaningfully different daily water requirements on the same calendar day. A table that gives one millimetre figure per stage has already erased that difference. The PlantVillage material on Kenyan maize points growers to the Wapor dataset as a source of daily ET0 estimates, though it notes the specific dashboard link it references might not work, worth checking before you plan around it rather than assuming the tool is live.
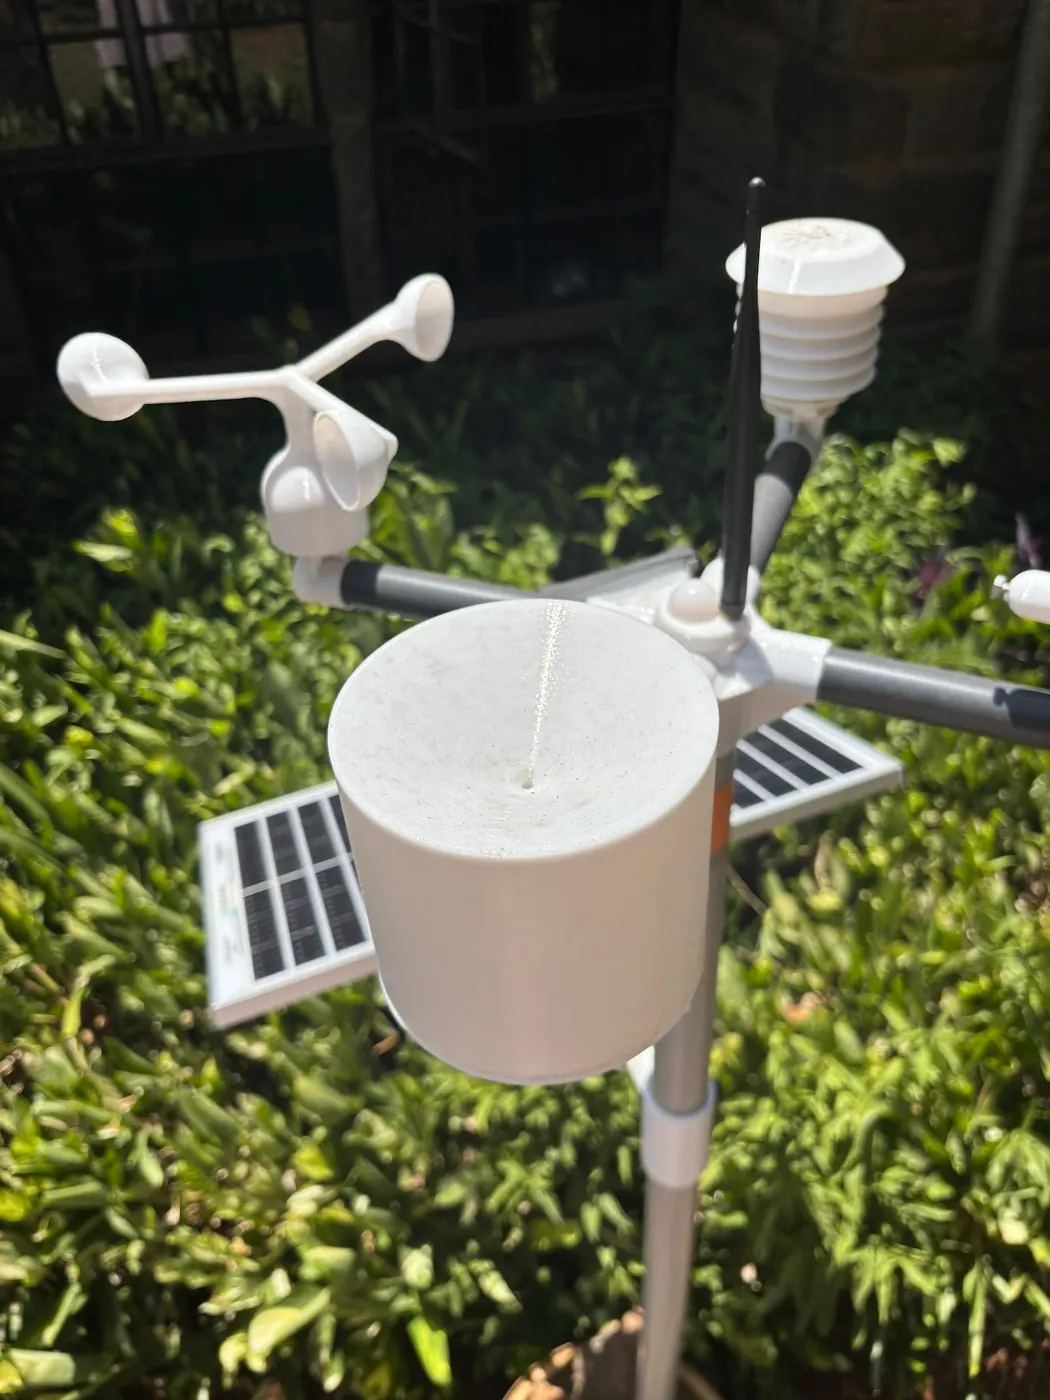
A weather station that logs air temperature, humidity, solar radiation and wind on site lets you compute ET0 for that specific location rather than borrowing a regional average. That is a meaningfully different number from a county-level satellite estimate, particularly on a farm that sits in a microclimate, a valley bottom or a windward slope, that the regional average does not represent well.
Why the growth stage matters more than the calendar date
FAO's four-stage framework, referenced in the PlantVillage summary, does not divide the maize season by weeks on a calendar. It divides it by crop development: initial, development, mid-season and late season, with Kc rising through the first three and falling in the fourth. Two farmers who planted two weeks apart are not at the same growth stage on the same date, and applying a calendar-based irrigation schedule to both will get one of them wrong.
This matters practically because the third stage, where Kc peaks, generally overlaps with tasseling and silking, the period breeders and agronomists usually flag as the point where maize is least forgiving of water shortage. A fixed-calendar irrigation plan can easily under-water a crop precisely when its coefficient, and therefore its daily requirement, is at its highest, simply because the planting date shifted the biology relative to the calendar.
Watching the crop rather than the date is the only way around this, and it is also the part that a soil probe helps with in a way a rain gauge cannot. A shallow probe tracks how quickly moisture is drawn down after rain or irrigation, and a deeper probe shows whether water is reaching the root zone at all, or sitting near the surface where it evaporates before the plant can use it. Neither reading substitutes for the Kc times ET0 calculation, but together they show whether the calculation is holding up against what is actually happening in the soil. More on how these sensors are deployed is in the overview of IoT farm sensors.
The gap between rainfall and what maize can actually use
Even where a table gets the crop-side maths right, it usually assumes all rainfall is usable. It is not. PlantVillage's material on Kenyan maize notes that effective rainfall, the fraction a crop can actually take up rather than lose to runoff, drainage below the root zone or evaporation, can be as low as 50 percent or lower. That is a wide range, and it depends on soil, slope, storm intensity and how saturated the profile already is, none of which a national table can capture.
The practical consequence is that a farmer reading 40 mm off a rain gauge cannot assume the crop received 40 mm of usable water. If half of that is lost, the crop's real water balance is short by an amount the gauge never shows. This is precisely the kind of gap a soil probe closes: it tells you what moisture arrived at the root zone, not what fell from the sky. A rain gauge and a soil sensor answer different questions, and conflating them is a common source of over-confidence in irrigation scheduling.
There is also a waterlogging side to this that tables ignore entirely. Excess water is a documented risk for smallholder maize in Kenya, not just deficit. Vulnerability of Smallholder Maize Production to Climate notes floods contributing to waterlogging in maize production, a failure mode that a millimetre-per-stage table, built entirely around the deficit side of the water balance, has no mechanism to warn against.
Planting date is a water decision, not just a calendar one
PlantVillage's analysis of 120-day maize crops planted between 1 March and 31 May found that, using historical analog years, later planting generally means the crop receives less total rainfall over its cycle, in most Kenyan counties. This turns planting date into a water-management decision rather than a purely agronomic one about germination conditions or labour scheduling.
The historical record backs this up at a national scale, even if the mechanism there was rainfall failure rather than planting delay alone. In 1997, the long rains, which normally start mid-March, arrived ten days to two weeks late, and by end of April, area planted to maize nationally sat at 1.044 million hectares against a target of 1.2 million, according to the Special Report on Kenya 05/97. Rift Valley Province, which the report states accounted for roughly 60 percent of long rains maize output at that time, saw plantings decline 19 percent from an already reduced prior year.
That regional concentration is worth sitting with. If the province producing the majority of a season's maize is also the one most exposed to a late start, a national average rainfall figure hides the real risk. A grower in the Rift Valley reading a national or even county-level water requirement estimate is reading a number diluted by regions that were not hurt as badly. This is an argument for site-level ET0 and soil data over regional averages, not an argument against using averages at all; they are a starting point, nothing more.
What the 2000 season shows about compounding water stress
The clearest illustration of stacked water failure in the fact record is the 2000 long rains season. The SPECIAL REPORT: Kenya, 10 July records that the long rains failed except in parts of Western and Nyanza provinces, with Rift Valley and Central receiving little or no rainfall. Area planted came to only 79 percent of the long rains average, and the crop itself was forecast at 1.4 million tonnes, 36 percent below the long rains average of 2.21 million tonnes, and 22 percent below the already drought-reduced 1999 long rains crop of 1.8 million tonnes.
None of that shortfall shows up in a stage-by-stage millimetre table, because the table describes what maize needs under normal conditions. It says nothing about what happens when the rain simply does not arrive in a given province in a given year. The same report puts the national utilization requirement for 2000/2001 at 3.21 million tonnes against domestic production of 1.85 million tonnes, forcing an import requirement of around 1.4 million tonnes until the September 2001 harvest. It also records that retail maize prices in Nairobi, Mombasa and Kisumu rose by 91, 98 and 75 percent respectively between January and July 1999, a rise that shows how quickly local price responds to a shortfall no water-requirement table ever predicted.
Two rainy seasons, two very different exposure profiles
Kenya's long rains, March to May, normally provide about 80 percent of annual food production, while the short rains, October to December, account for roughly 20 percent of cereal output nationally, per the SPECIAL REPORT: Kenya. This split matters for how you think about maize water requirement because the two seasons are not smaller and larger versions of the same risk. The short rains are the primary season in Kenya's arid and semi-arid areas, which means a maize water requirement calculation built around long-rains ET0 and rainfall patterns can be badly wrong if applied to a short-rains crop in a drier zone.
This is one more reason a single national millimetre table cannot do the job that its confident presentation implies. A table has to pick a season, a Kc curve and an ET0 assumption, and whichever combination it picks will be wrong for growers outside that combination. A farmer in a semi-arid short-rains zone reading a long-rains table is reading a mismatch dressed as a rule.
The practical response is not to demand a better table, since no single table can cover both seasons and every altitude band at once. It is to compute the two terms locally: ET0 from on-site weather data, and soil moisture response from a probe in the ground, and let those two numbers, refreshed daily, replace the fixed figure the table was trying to approximate. That is a more demanding workflow than reading a chart off a leaflet, but it is the only version of the calculation that actually answers the question a table pretends to.
What irrigation scheme guidance actually asks for
It is worth being precise about what official irrigation documents in Kenya do and do not specify. The Baringo County irrigation guidelines reference a scheme water requirement that farmers or Irrigation Water Users Associations use to apply for authorization to construct water harvesting and storage infrastructure. That is an administrative and infrastructure-sizing figure, not a stage-by-stage maize water table. Reading it as a growth-stage number would be a misuse of a document written for a different purpose entirely, and it is a good example of how easily a real figure gets stretched to answer a question it was never built to answer.
Similarly, the Tegemeo policy brief noting Kenya's annual maize output at roughly 39 million bags against consumption demand of about 36 million bags is a national supply-demand snapshot, not a water requirement figure at all, and it carries no date attached in the source. It is useful for understanding why irrigation expansion is discussed as a policy question, but it says nothing about how many millimetres a maize plant needs at silking.
A cross-country comparison from the World Bank's review of actual crop water use, Actual Crop Water Use in Project Countries, notes that maize at one comparison site, Kroonstad, showed the second-smallest gap between actual water use and calculated requirement, after sorghum. Kroonstad is in South Africa, not Kenya, and the figure should not be read as a Kenyan number. It is useful only as a reminder that the gap between calculated requirement and actual use varies by crop and site, and closing it is the entire point of measuring rather than assuming.
Building a local water picture instead of hunting for a table
Given all of the above, the more honest answer to what maize needs at each growth stage in millimetres is that no single answer exists, and any document claiming otherwise is quietly assuming a location, a season and a variety that may not be yours. What does exist is a method: multiply a Kc value appropriate to your variety and growth stage by an ET0 figure measured for your location and date, then check the result against what the soil is actually doing.
This is where farm-level instrumentation earns its place, not as a replacement for agronomy but as the missing local input the FAO method has always required. A weather station on site produces the temperature, humidity, radiation and wind data needed to compute a genuine local ET0, rather than borrowing a county or regional figure that may sit some distance from your actual microclimate, discussed further in Smart irrigation in Kenya, an overview. Soil moisture readings from a shallow and a deeper probe then show whether the water implied by that calculation is actually reaching and staying in the root zone, or draining past it, or being lost to evaporation before the plant benefits.
None of this produces a clean millimetre-per-stage number you can print on a card and hand to a field supervisor. It produces something more useful: a live, location-specific read on whether this week's water balance matches what the crop's current growth stage demands. Given how much the 2000 and 1997 seasons show about what happens when that balance goes wrong at a regional scale, that is a trade worth making.
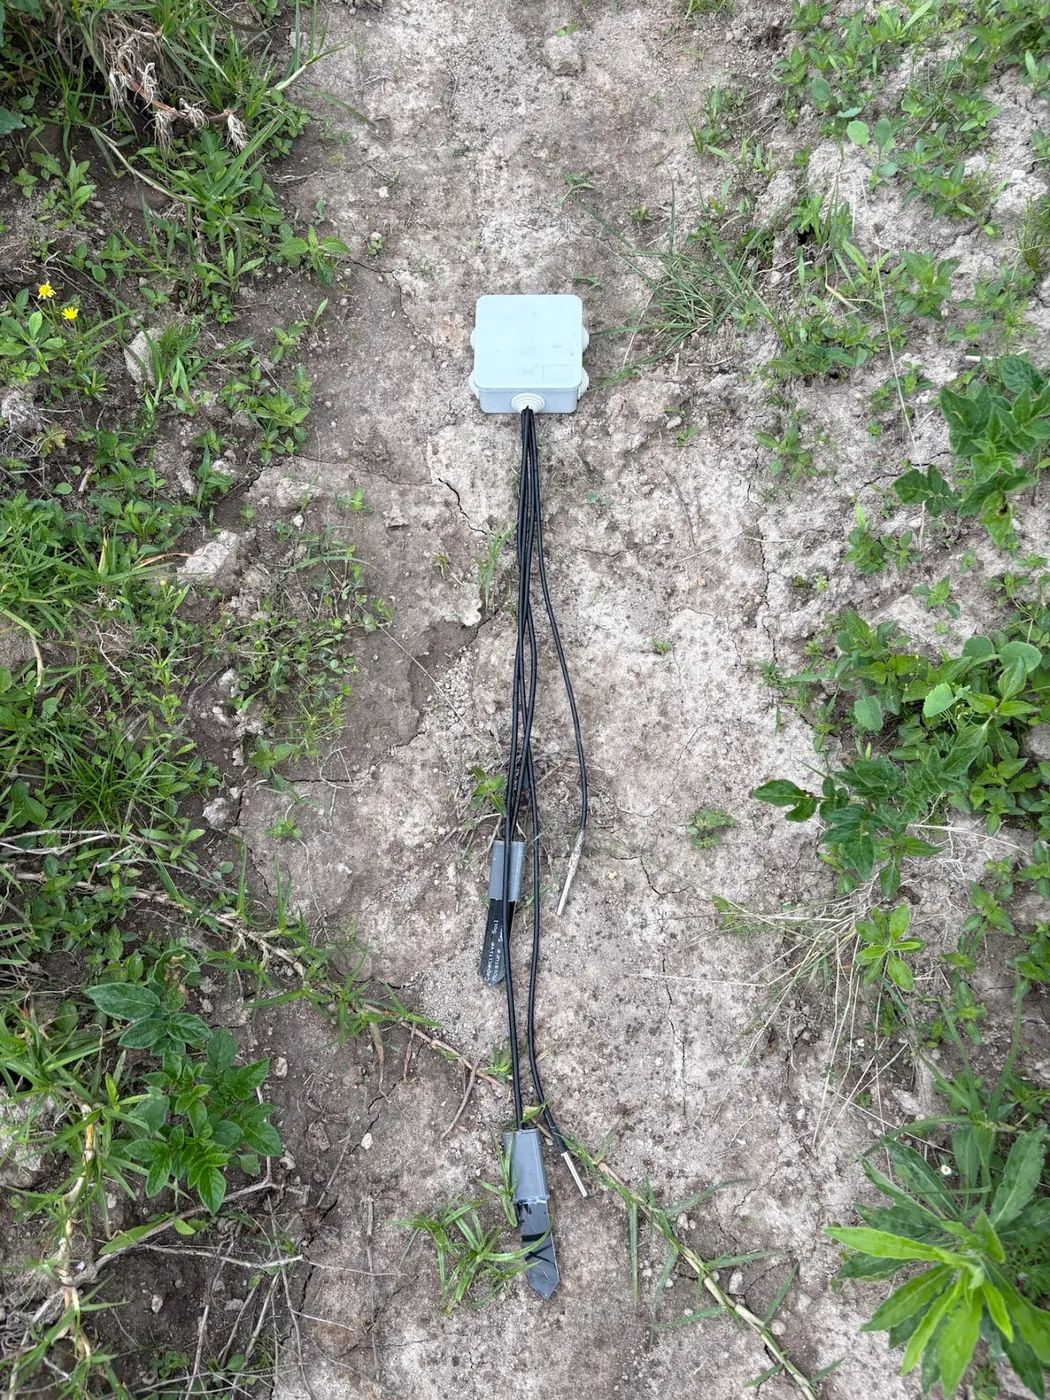
NuaSense builds the sensors behind these numbers: soil probes at two depths, a weather station that computes ET0 hourly, and the dashboard that turns both into an irrigation decision. See what NuaSense offers.