The decision a farm manager actually faces this season
The fertiliser price Kenya counties see each season rarely reflects dealer margins as much as people assume. A farm budgeting for the next planting season in Kenya does not face one fertiliser price. It faces at least three: a subsidised price at a government depot if the farm can reach one and qualifies, a cooperative price if the crop and county have a scheme, and the open market price at the nearest agrovet if neither of the first two applies. The gap that shows up in casual comparisons, one farmer paying a fraction of what a neighbour in another county pays, is usually a symptom of which of those three channels a farm can actually use, not a sign that dealers in one county are charging more for the same bag. That distinction changes what a farm manager should do about it. Chasing a lower headline price without checking eligibility, or whether the nearest depot even stocks it, wastes a planting window. This piece treats fertiliser sourcing as what it is: a set of channels with different costs, different eligibility rules and different reliability, works through what each one buys a Kenyan farm, and sets out a position on which combination makes sense before looking at where a farm's own monitoring data fits in. Kenya's own fertiliser use figures show why lumping counties into a single average is already a mistake, which the next sections work through in order.
Two official prices for the same bag
Start with the plainest fact available. Kenya's subsidised fertiliser has been sold at Sh2,500 a bag against an original price of Sh6,500, through NCPB or KNTC stores, according to the Ministry of Agriculture's account of the distribution programme. Sh6,500 minus Sh2,500 is a Sh4,000 saving, close to two thirds off the original price. That is not small. It is also not a price every farm can reach. The Ministry's own account describes a Principal Secretary visiting the NCPB depot in Soy Constituency, Uasin Gishu county, specifically to monitor how the subsidised programme and certified seed distribution were moving, which tells you the government itself treats depot-level delivery as the thing worth checking, not the headline price. A farm on the right allocation list, near a stocked depot, buying an eligible product, pays Sh2,500. A farm without depot access, or needing a fertiliser type outside the subsidised range, pays whatever an agrovet or distributor is charging that month. Both farms could sit in the same county, and both could report a fertiliser price to a survey. The resulting county average tells you almost nothing about either farm's actual price, because it blends two access regimes into one figure. The Ministry has also flagged plans to open more distribution points through farmer cooperatives to close this last-mile gap, which is the clearest sign that access, not dealer pricing, is the variable the government itself is trying to fix.
Why a county average hides two different farms
The access gap is larger than a subsidy discount alone explains. Tegemeo Institute's research on fertiliser use across Kenya found rates ranging from under 10 percent of surveyed households in drier lowland areas to over 95 percent of small farmers elsewhere in the country. That is not a gap of a few percentage points. It is two different agricultural economies operating under one national policy. A county weighted toward the second group, with established agrovet networks and functioning cooperatives, shows a fertiliser price close to the competitive market rate, because most farmers there already buy and vendors compete for their business. A county weighted toward the first group, with thin agrovet coverage, shows a higher and more erratic price, not because dealers there are gouging farmers but because there is not enough regular demand to support competitive stocking, and the few farmers who do buy pay whatever a single vendor decides to charge. This is where a farm's county label stops being useful. Knowing your county has a high overall uptake rate tells you nothing about whether your specific ward shares it. The Tegemeo figures are national in scope, and nothing in that dataset breaks the range down to individual counties, so a farm cannot look up its own county and expect a clean answer. What it can do is treat the range as a warning against trusting any single county average, and check its own local vendor coverage directly.
What the subsidy programme covers, and what it doesn't
The subsidy story gets more specific once you look at which crops it has actually targeted. Kenya's fertiliser subsidy has, in at least one documented channel, focused on distributing fertiliser to coffee farmers at a price below the market rate, according to research on the coffee subsidy programme. That is a crop-specific channel, not a blanket discount available to every grower in every county. A maize farmer in a county with strong coffee cooperative infrastructure does not automatically get the coffee rate, because the scheme is built around the coffee value chain, not the county boundary. This matters because the discount often gets discussed as if Sh2,500 fertiliser is simply the Kenyan price, and anything above it is a rip-off. It is a price for specific products, through specific channels, sometimes tied to specific crops, and a farm's actual price depends on where it sits relative to all three. A separate strand of research, a 2014 study by Welime, documented in later work, looked specifically at the effects of fertiliser price subsidies on fertiliser use in Bungoma County, which at least confirms county-level subsidy effects have been studied directly rather than only assumed from national figures. That kind of study is rare enough that a farm manager outside Bungoma should not expect an equivalent for their own county to already exist. Most Kenyan counties simply do not have a published, county-specific breakdown of subsidy reach, and a farm has to build its own access picture.
What a price-sharing platform in Murang'a actually changed
If missing information about prices were the problem, an SMS or USSD platform sharing stock and prices between vendors and farmers should move the market. Kenya has tried this. MazaoPlus+, piloted in Murang'a County, let vendors update fertiliser stock and let farmers ping the system to find who was selling what, and at what price, according to the World Bank's account of the pilot. The most-queried products ahead of planting and top-dressing seasons were DAP, N.P.K 23, CAN and urea, which lines up with what most Kenyan row-crop farms apply. Farmers who used it said it was useful, and asked for it to extend to animal feed and pesticides too. But the number that matters most here is a quieter one: average fertiliser prices stayed nearly the same throughout the pilot. Better information about who was selling what did not compress the price spread. That is not a design failure. It is evidence about what actually sets fertiliser prices in a place like Murang'a: supply and logistics, not farmers being unaware of a cheaper vendor nearby. The conclusion for a farm manager is specific, not vague. SMS and USSD tools like this are worth using to find stock when a depot or agrovet has run out, and to know which products are moving before committing budget. They are not a tool for negotiating a better price, because the Murang'a evidence says price does not respond much to information alone.
The macro swings sitting underneath every county number
None of this happens in a vacuum. Fertiliser consumption data tracked by the World Bank is built from production plus imports minus exports, and because some of the same compounds have other industrial uses, that measure can overstate what is actually available for crops. More useful for a farm manager is what the same dataset says about exposure: fertiliser consumption as a share of production signals how vulnerable a country's agriculture sector is to swings in import and energy prices, according to the World Bank's fertiliser consumption indicator. Kenya imports a substantial share of the nutrients it applies, so a shock in global fertiliser or fuel prices reaches a Kenyan farm gate faster than most growers expect, and it reaches every county at roughly the same time, even if the size of the effect at the retail counter varies with how thin or thick local vendor competition is. The same dataset notes that excessive nitrogen fertiliser use can raise the birth rate, longevity and general fitness of pests such as aphids, and that over-application causes fertiliser burn, a reminder that the price question and the use question are not the same problem. FAO's review of the run-up to the 2007 to 2008 food price crisis notes that producers in developing countries faced real, inflation-adjusted price declines across most of the previous fifty years, according to FAO's account, which discouraged the on-farm and input-supply investment that would otherwise have built stronger local fertiliser markets. A county with thin agrovet coverage today is, in part, inheriting decades of underinvestment that predates any single season's subsidy rollout.
Comparing the options: what each channel costs and what it buys
Lay the choices side by side rather than treating fertiliser sourcing as one decision made once a season.
- Subsidised store, NCPB or KNTC: cost is Sh2,500 against an original Sh6,500 for eligible products. What it buys: a large saving if your farm can reach a stocked depot and the product on offer matches your crop's need. What it does not buy: certainty of stock, or coverage for products outside the subsidised range.
- Cooperative channel: cost varies by crop and cooperative, documented for coffee farmers who receive fertiliser below the market rate. What it buys: a below-market price tied to your crop's value chain, plus last-mile delivery infrastructure the Ministry is trying to extend to other crops through cooperatives. What it does not buy: access if your crop has no equivalent scheme.
- Open market agrovet: cost is the full local market rate, whatever vendors are charging that month. What it buys: immediate availability, no eligibility list, no waiting on depot allocation. What it does not buy: any discount, and in thin-vendor counties, competitive pricing.
- SMS or USSD stock platforms, in the style of the Murang'a pilot: cost is essentially your time and a phone. What it buys: visibility of who is stocking what nearby before a planting or top-dressing window closes. What it does not buy: a lower price, since the pilot's own average prices barely moved.
None of these four channels is free of a catch, and the catch is almost always access or eligibility, not the number printed on the bag.
The position worth taking
Given all that, the practical stance is this: treat the subsidised price as worth checking every season, not worth budgeting around. Confirm whether your farm's product and location are actually covered before you plan cash flow on Sh2,500 fertiliser, because the programme is built around specific depots and, in the coffee channel, specific crops. Budget your baseline at the open market rate, because that is the price you pay if the depot has run out, your product isn't on the subsidised list, or the season's allocation closes before your turn. Use an SMS or USSD platform, where one operates near you, to find stock quickly rather than to hunt for a lower price. That follows directly from what the Murang'a pilot and the subsidy documentation both show: access and stock availability move faster and matter more than the price differences discussed in farmer WhatsApp groups. Kenya's own policy research backs this from another angle: fertiliser strategy pays off only alongside improvements in rural roads and extension services, according to World Bank research on Kenya's fertiliser policy reforms, which is the same last-mile problem showing up from a different direction. Where a farm has real leverage is in the channel it builds a relationship with over several seasons, a cooperative for crops that have one, a depot for others, rather than shopping the whole market fresh every planting. A farm treating every season as a price hunt will keep landing at the market rate by default, because discounted channels reward standing relationships more than searching.
Where monitoring fits, and where it doesn't
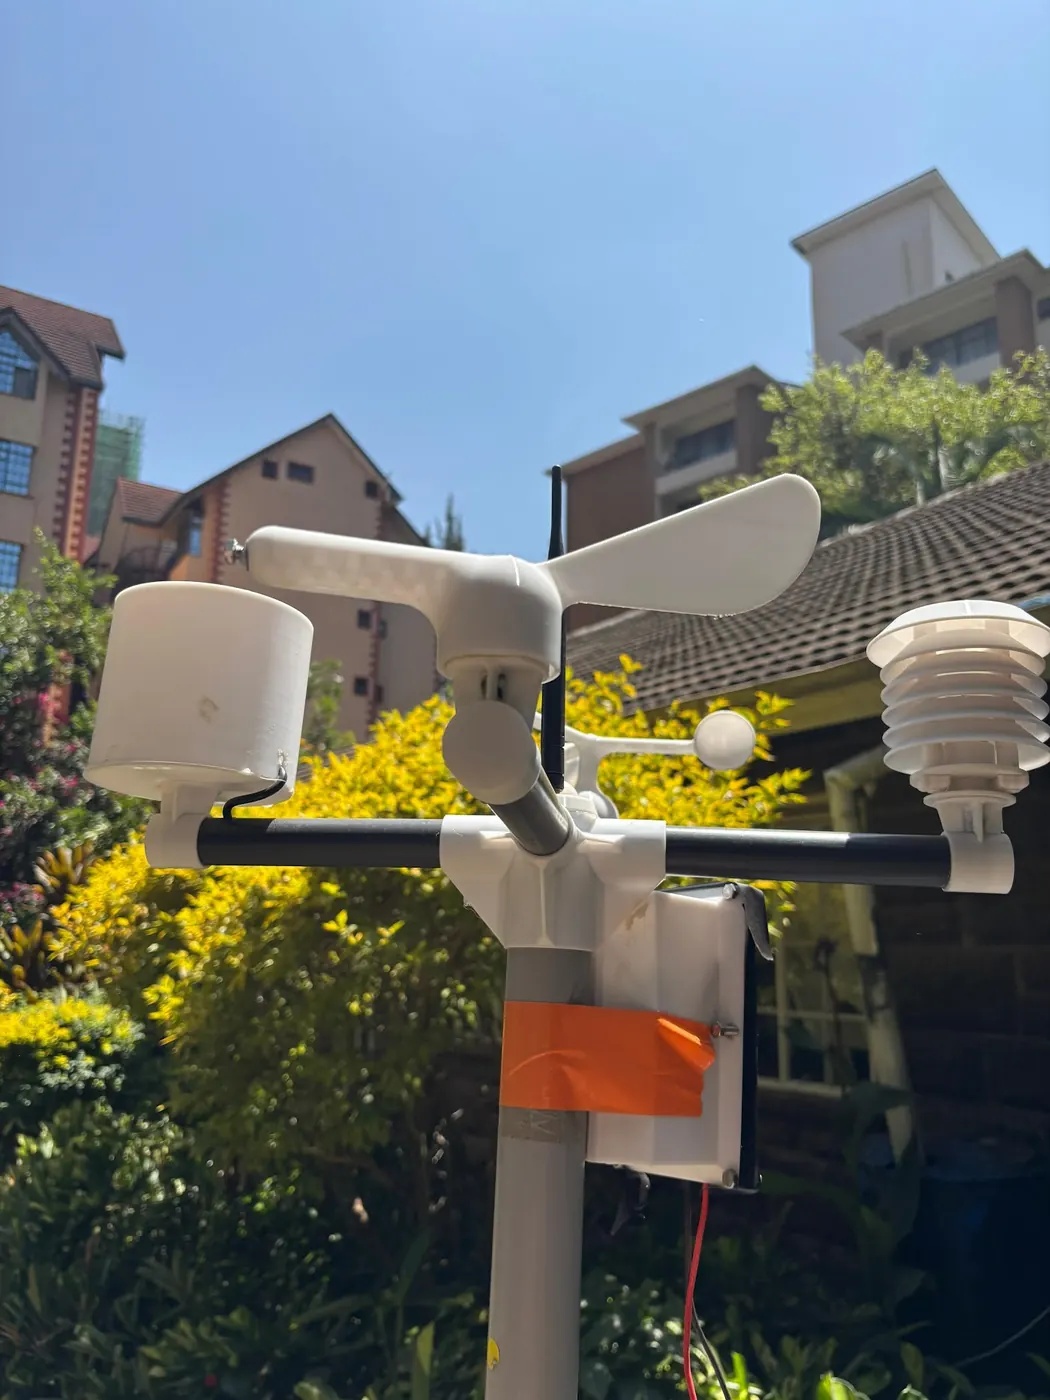
Fertiliser price is one lever. Fertiliser use is the other, and it is the one a farm actually controls day to day. Applying nutrients without knowing what the soil already holds is how a farm ends up buying more than it needs. Over-application does not just cost money: excess nitrogen fertiliser can raise the birth rate, longevity and fitness of pests such as aphids, and over-fertilising causes fertiliser burn, drying and damaging the crop it was meant to help, both documented in the World Bank's fertiliser consumption background material. Neither problem is solved by a cheaper bag. It is solved by applying less, more precisely, timed to when the crop and soil can actually use it. This is where monitoring earns its place, not as a substitute for the access decisions above but as a way to spend whatever fertiliser you buy more carefully. NuaSense's soil probes report relative moisture at two depths, a shallow and a deeper reading, alongside soil temperature at each, so a farm can see whether an application is likely to move into the root zone or sit on dry soil doing nothing. The weather station layer adds reference evapotranspiration and a spray window score, useful for timing a top-dressing round around real conditions rather than the calendar. NuaSense's own post on IoT applications in Kenyan agriculture covers low-cost sensor options and mobile-based platforms Kenyan smallholders can actually afford, including how monitoring reduces input waste directly. None of this changes what a bag of DAP costs at the depot. It changes how much of that bag reaches the crop, the part of the input bill a farm fully controls regardless of county. More on the fertiliser side of that decision, and on the IoT farm sensors behind it, is worth reading before the next application round.
What still isn't known, and how to find your own number
Be honest about the limit here. There is no published, county-by-county fertiliser price table for Kenya in the sources behind this piece, and claiming one exists would be inventing data the government and research institutions have not produced. What exists is a national subsidised price, a national market figure (fertiliser prices fell by close to 45 percent, from $245 to $140 a ton, over a ten-year period, according to the Competition Authority of Kenya's fertiliser market inquiry), and a scattering of county and crop-specific studies that do not add up to a comparable grid. A farm manager who wants a real number has to build one: call two or three agrovets in the ward, check the nearest NCPB or KNTC depot's current stock and eligibility, and ask a cooperative officer, where the crop has one, what its current rate is. That is a handful of phone calls, not a research project, and it produces a more reliable figure for that specific farm than any county average could. The market inquiry itself exists because pricing across the sector was opaque enough to need a formal competition review, which is its own evidence that no clean county comparison was sitting on a shelf waiting to be summarised. The wider lesson from LSMS-ISA survey work across six Sub-Saharan African countries, covering more than 22,000 households and 62,000 plots, is that macro-level statistics miss exactly this kind of within-country variation, while household and plot-level surveys with GPS data can catch it. Kenya does not yet have an equivalent public dataset at that resolution for fertiliser prices, and a farm operating today has to fill the gap itself rather than wait for one.